Key Data Dashboard


For vacation rental managers who want to better understand their business and competitive performance, Key Data Dashboard is a business intelligence (BI) and benchmarking tool that provides clear, easy to understand visibility into all the core metrics that drive your business, displayed side by side with similar performance data from your local and regional competitors.
Unlike pricing tools and data scrapers, Key Data empowers you with full visibility into your business’ most important data, while providing the industry’s only direct-source data showing how you stack up to competitors in your market.
Built for vacation rental managers, Key Data is packed with features helping you focus on your business performance so you can increase revenue as well as save time.
- Real Time Pacing Charts: Monitor your top KPIs so you can keep an eye on what matters most to you and your business.
- Performance Insights: Full pacing charts to examine future performance as of today vs. last year’s performance as of the same date.
- Benchmark Reports: Benchmarking charts to see how your metrics compare to other companies in your market and region.
- Filterable Charts & Metrics: Filter by Bedroom, Area, # Sleeps, and additional ways to better understand your performance and problem areas.
- Historical Performance Data: In-depth analytics looking back as well as forward at your company’s core metrics.
- Seamless PMS Integrations: Designed to save vacation rental companies hours of pulling various data sources together.
- Monitor Forecast & Budget (coming soon): Spend more time making informed revenue decisions for your business.
- Personalized Dashboards by Job Role (coming soon): Empower informed decision-making throughout your organization.
- Scheduled Notifications (coming soon): Build custom alerts for daily, weekly or monthly updates straight to your inbox.
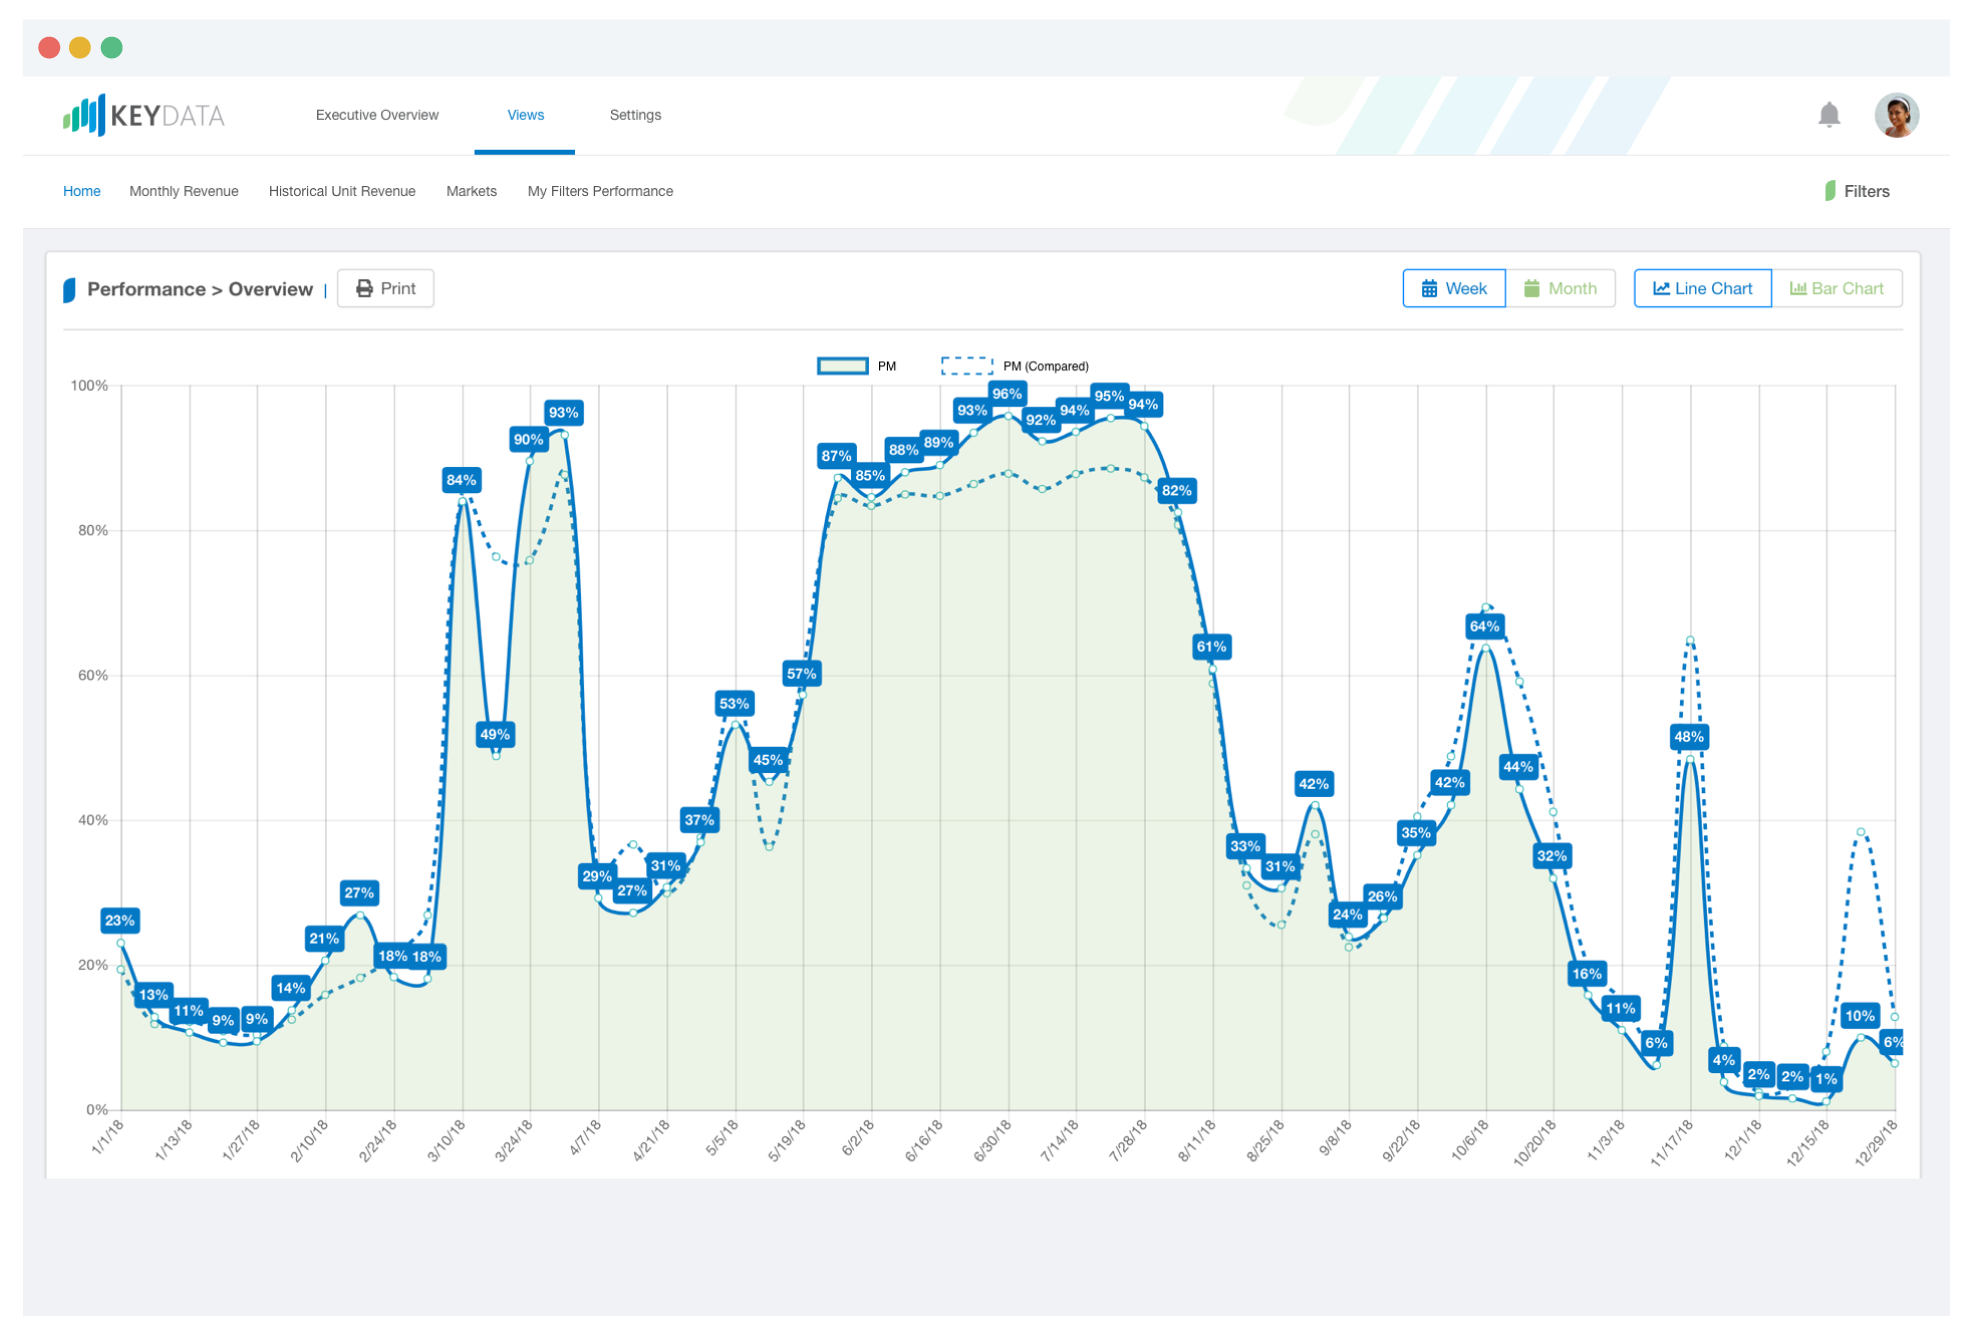
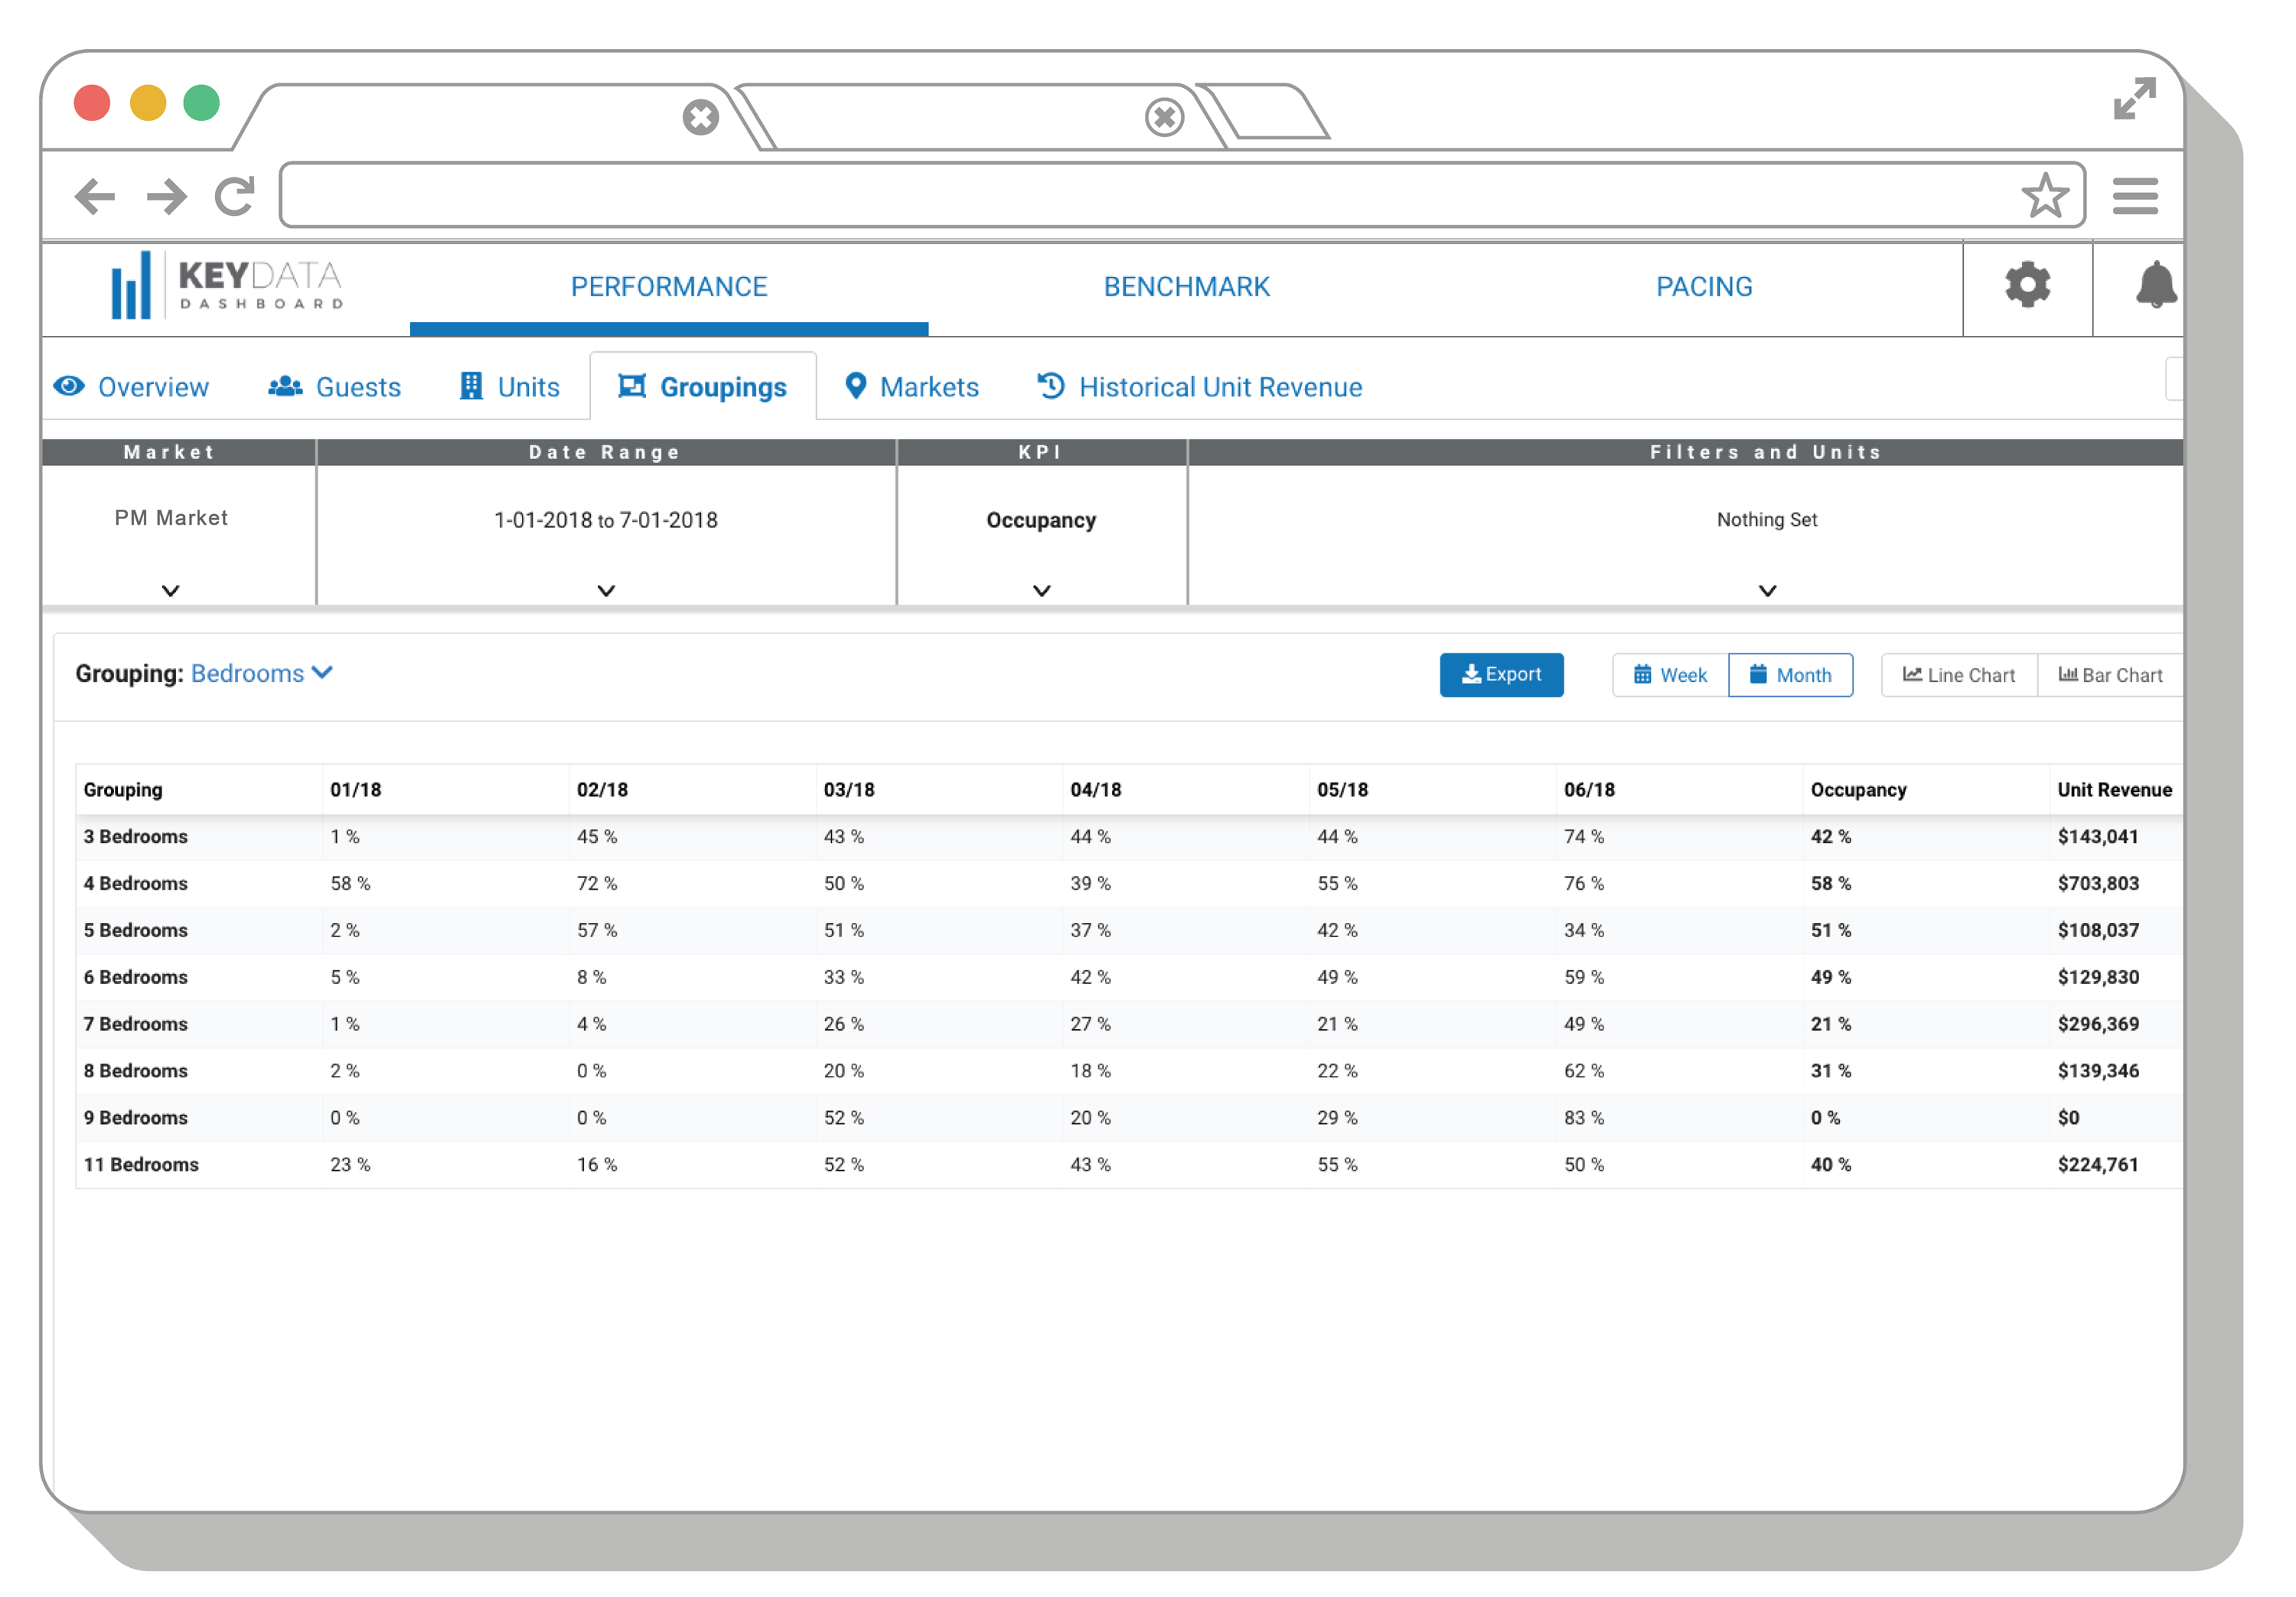
Visualize Your Vacation Rental KPIs
Filterable charts and metrics by Bedroom, Area, # Sleeps, and tons of other ways to better understand your business performance and problem areas so you can make adjustments when and where needed.
- Instant Visualization Of Your Vacation Rental Data
- Stop Spending Hours Organizing Excel Data
- Unit by Unit Level Performance Data
- View & Filter 30+ KPIs
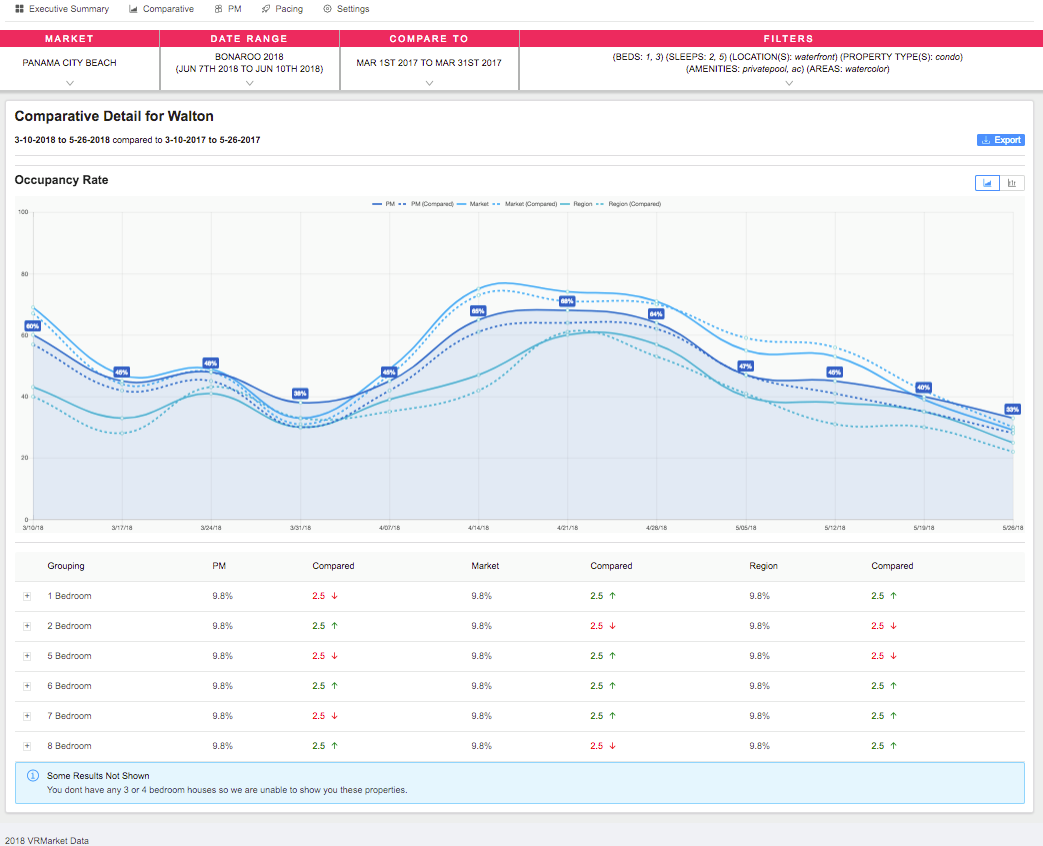
How Do You Compare to Your Market?
The vacation rental industry’s first robust business intelligence (BI) dashboard providing in-depth analytics into your company’s core metrics like Occupancy, ADR, RevPar, Available Occupancy & much more allowing you to instantly understand how your business is doing compared to your competitors all in one place.
- Benchmark Local & Regional Market Reports
- Accurate, Reliable Data via seamless PMS Integrations
- No more need for competitor scraping
Full Pacing Charts to Examine Future Performance
Build & execute your strategy with our detailed pacing dashboard, and reinforce it by comparing your current, historical, and projected KPIs to make adjustments when and where needed.
- Real Time Pacing Charts
- Insights Into Year Over Year Pacing
- Visualize Monthly Revenue Breakdown
- Monitor Your Top KPIs
No reviews yet. Want to share a review? Click here